
Simulating Degradation Data for Prognostic Algorithm Development
shared by Abhinav Saxena, updated on Sep 10, 2010
Summary
PHM08 Challenge Dataset is now publicly available at the NASA Prognostics Respository + Download
INTRODUCTION - WHY SIMULATE DEGRADATION DATA?
Of various challenges encountered in prognostics algorithm development, the non-availability of suitable validation data is most often the bottleneck in the technology certification process. Prognostics imposes several requirements on the training data in addition to what is commonly available from various applications. It not only requires data containing fault signatures but also that contains fault evolution trends with corresponding time indexes (in number of hours or number of operational cycles).
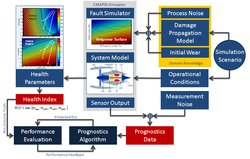
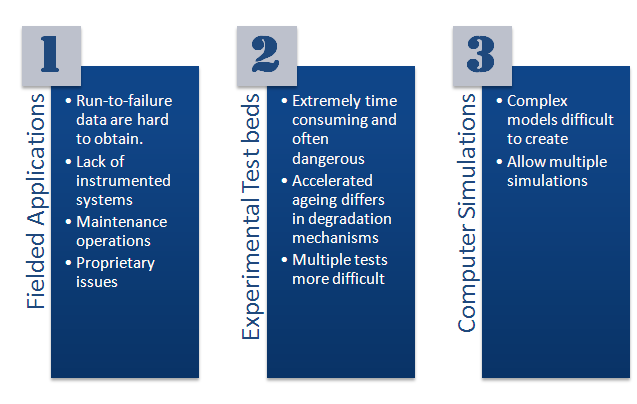
In general there are three sources from which data is usually available, namely: Fielded applications, experimental test-beds, and computer simulations (see Figure 1). From prognostics point of view, data collection paradoxically suffers from the situation that the systems that do run to failure often did not have warning instrumentation installed, hence no or little record of what went wrong. In the other situation, those that are continuously monitored are prevented from running to failure or are subject to maintenance that eliminates the signatures of fault evolution. Conducting experiments that replicate real world situations is extremely expensive in terms of time required for a healthy system to run to failure and is often dangerous. Accelerated ageing may be useful to some extent but may not emulate normal wear patterns. Furthermore, to manage uncertainty multiple datasets must be collected to quantify variations resulting from multiple sources, which makes it all the way more unattainable. Simulations can be fast, inexpensive, and provide a number of options to design experiments, but their usefulness is contingent on the availability of high fidelity models that represent the real systems fairly well. However, once such a model is available, simulations offer the flexibility to rerun various experiments with added knowledge from the system as it becomes available. Where, availability of real fault evolution data from the fielded systems would be more desirable, generating data using a high fidelity model and integrating it with the knowledge gathered from the partial data obtained from the real systems is by far the most practical approach for prognostics algorithm development, validation, and verification.
In this presentation we discuss some key elements that must be kept in mind while generating datasets suitable for prognostics. Furthermore, with the help of an example it has been shown how a dynamical system model can be supported with suitable degradation models available from respective domain knowledge to create suitable data. The example is discussed next.
APPLICATION DOMAIN
Tracking and Predicting the progressionof damage in aircraft turbo machinery has been an active area of study within the Condition Based Maintenance (CBM) community. A general approach has been to correlate flow and effciency losses to degradation signtures in various components of the engine. Once such mapping is available, the next task is to estimate this loss of flow and eficiency inferring information from measurable sensor outputs, which ultimtely is used to assess the level of degradation in the system.
SYSTEM MODEL: C-MAPSS
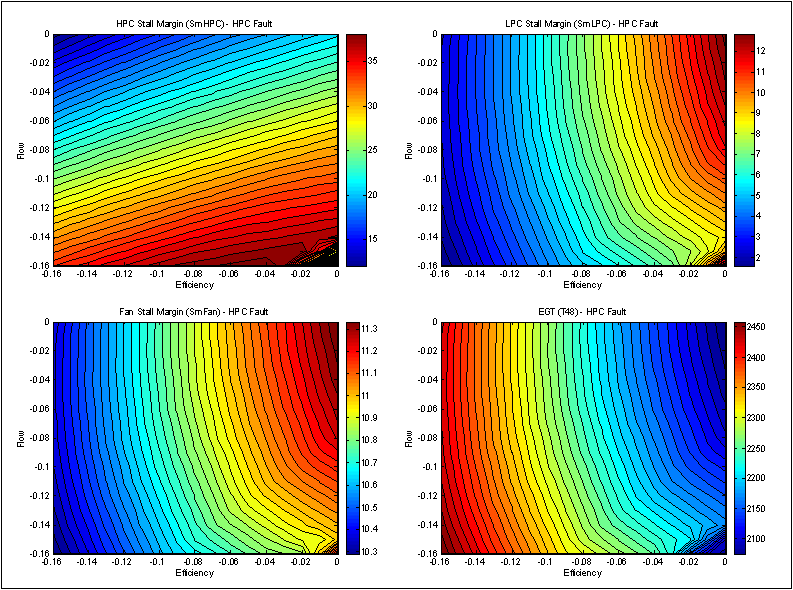
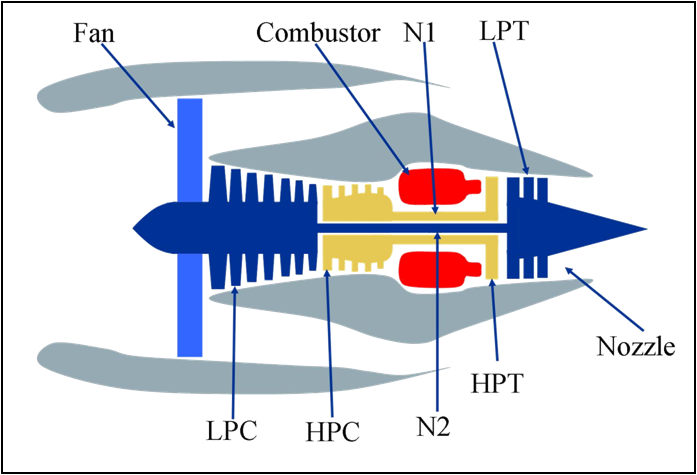
The C-MAPSS (Commercial Modular Aero Propulsion System Simulation) is a tool, recently released, for simulating a realistic large commercial turbofan engine. C-MAPSS (Commercial Modular Aero-Propulsion System Simulation) that simulates a realistic large (~90,000lb) commercial turbofan engine. It allows the user to choose and design operational profiles, controllers, environmental conditions, thrust levels, etc. to simualte a scenario of interest. An extensive list of output variables is available that simulate sensor channels. Most importantly, it allows user to tune eficiency and flow parameters to simulate specific fault modes. They are required to generate a two dimensional map (Figure 2) between these parameters and the degradation indicator of interest. Industry typically uses operability margins of main engine rotating components namely e.g. HPC, LPC, HPT, LPT, and Fan (Figure 3)
DEGRADATION MODELING
The simulations were run to generate data for various flight profiles an engine might go through to accumulate degradation during its life-span. This scenario models engine performance degradation due to wear and tear based on the usage pattern of the engines and not necessarily due to any particular fault mode. Therefore, sudden degradation during a flight is rather unlikely. This allowed taking one measurement snapshot per flight to characterize the engine health during or right after that flight. Specific components of degradation simulation modeled are:
- Initial Wear:
Initial wear can occur due to manufacturing inefficiencies and are commonly observed in real systems. Although it is not considered abnormal, it can make a difference in useful operational life of a component. the degree of wear was modeled based on information available from domain literature.
- Noise:
Of various sources, the main sources of noise while assessing the true state of system’s health are manufacturing and assembly variations, process noise (due to factors not taken in to account while modeling the process), and measurement noise to name a few important ones. These noise sources introduce their respective contributions at different stages of the process and a combined effect is observed in the sensor measurements at the end. Noise perturbations were injected at different stages based on information from the literature in noise modeling. (please see attached document for details)
- Damage Propagation Modeling:
Common models used across different application domains include the Arrhenius model, the Coffin-Manson mechanical crack growth model, and the Eyring model (for more than three stresses or when the above models are not satisfactory). Several variations of these models have been adopted for specific applications; however, common to all degradation models is the exponential behavior of the fault evolution. Further, some evidence available from the domain literature prompted the use of a generalized exponential degradation model. The generic nature of the model used in simulations ignores micro-level processes but retains macro-level degradation characteristics that are considered important for prognostics algorithm development independent of any specific application domain.
<img src="/dashlink/static/media/latex/cdc11692ef74730424bb87f4ea9ba562.png" class="latex" alt="LaTeX" />
where
<img src="/dashlink/static/media/latex/f17501e482a8b30ab78a37cbc33fd8c0.png" class="latex" alt="LaTeX" /> is initial wear

<img src="/dashlink/static/media/latex/c7c8b7e6d5f34d31f59735a2f1ec5280.png" class="latex" alt="LaTeX" /> is the upper wear threshold

<img src="/dashlink/static/media/latex/78c292f7a1a8bd8c88ea38e002ebc769.png" class="latex" alt="LaTeX" />  adds a non-stationary characterstic to degradation pattern

<img src="/dashlink/static/media/latex/7fc56270e7a70fa81a5935b72eacbe29.png" class="latex" alt="LaTeX" /> is a scaling constant
HEALTH INDEX
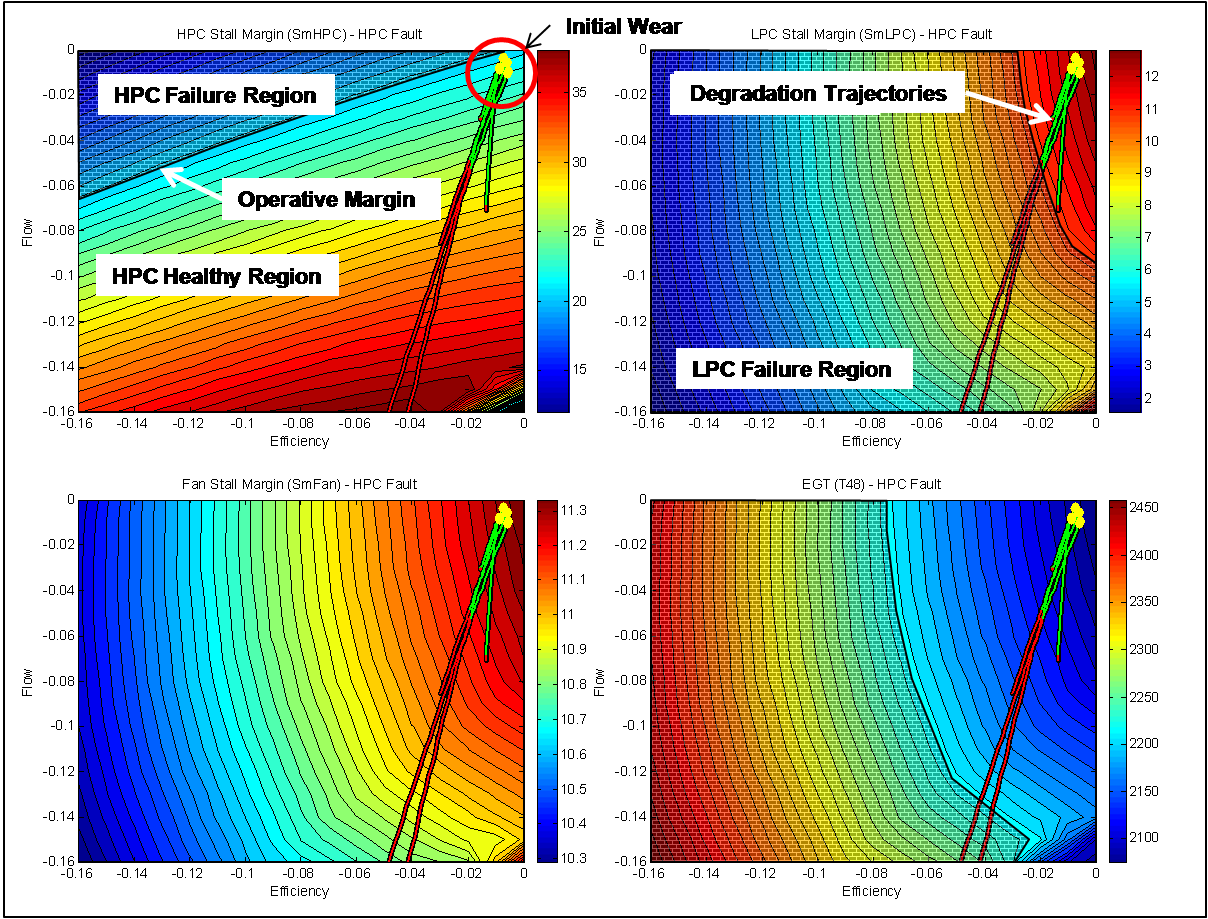
As degradation prameters evolve C-MAPSS simulates a degrading system. The extent of degradation at any instant can be assessed by determinng how various health indcators are approaching their threshold margins. Typically stall margins for rotating components of the engine (fan, turbine, and compressor) and exhaust gas temperature are monitored to determine the state of health. As degradation increases one or many of these parameters approach critical limits. Following the same methodology a Health Index (HI) is computed as the simulation proceeds.
The health index can be used to model different phenomena within a subsystem. Specifically, for aircraft engine modules like the compressor and turbine sections, the health is described both by efficiency (e) and flow (f). Trajectories for flow and efficiency vary for different fault modes and are modeled as separate health related indices as shown below:
<img src="/dashlink/static/media/latex/b15ef4f7b048175797e90f3d8817f213.png" class="latex" alt="LaTeX" />


<img src="/dashlink/static/media/latex/64417b64938f203dfd80c7b95c10a111.png" class="latex" alt="LaTeX" /> , and
the terms e(t) and f(t) are then combined to form the overall health H(t), i.e.
<img src="/dashlink/static/media/latex/b0aaf6f3aab1f8c548b37672de6fabab.png" class="latex" alt="LaTeX" />
where, the function  is the minimum of all operative margins considered (here for fan, HPC, HPT, and EGT).
<img src="/dashlink/static/media/latex/cf969033c68337a506c632e93d844c4c.png" class="latex" alt="LaTeX" />
where the margins s are the functions of efficiency and flow parameters. If system degradation is plotted on flow-efficiency axes, various margins indicating the deterioration can be depicted as shown in Figure 4. A threshold boundary separates the failure region for respective margins. Depending on the direction of the failure evolution trajectory (simulated by changing e and f parameters) a threshold may or may not be crossed. Therefore, the overall health index is determined by the margin that approaches the corresponding limit first. More details about HI calculation can be found in the attached paper.
PHM DATA CHALLENGE (details)
Data generated in this effort was used for PHM Data Challenge at the 1st International Conference on Prognostics and Health Management (PHM08). Six different flight conditions were simulated that comprised of a range of values for three operational conditions: altitude (0-42K ft.), Mach number (0-0.84), and TRA (20-100).The objective was to generate train, test, and validation data sets for development of data-driven prognostics. To that end, a reasonably large number of trajectories were created from C-MAPSS. To avoid over-fitting to the test data, the validation set was withheld and published later, without feedback of the score until after the competition had closed. Three winning entries are being featured in a special session at the conference. Please refer to conference proceedings to learn more about how different approaches can be used to predict RUL of the aircraft engine.
CONCLUSION
This poster discusses the data generation process using C-MAPPS, validity and usefulness of such data, and potential advantages in developing and maturing prognostic algorithms. Overall, this effort shows how in general industry expert knowledge can be used in tandem with high fidelity system models to reduce data availability gaps in the prognostics area.
Files
|
754.4 KB | 58 downloads |
|
63.8 KB | 62 downloads |
|
970.5 KB | 157 downloads |
|
3.2 MB | 33 downloads |
 3_modes.bmp
 Flow__Efficiency_2-D_Maps.gif
 Engine_Schematic.bmp
 Operative_Margins_3.bmp
Discussions
Abhinav's Projects (3)
-
-
-
 Prognostics Data Challenge
2 members
Need help?
Visit our help center