Description of Experimental Data
The Configuration and Background webpage also contains information regarding the test configuration. Wind tunnel tests were conducted at NASA Transonic Dynamics Tunnel of the Rectangular Supercritical Wing (RSW) in the 1980's and documented in RTO Report 26. More results are also published in other references. Time history data for this test (TDT Test number 353) is not available.
-
 <
<
-
 <
<
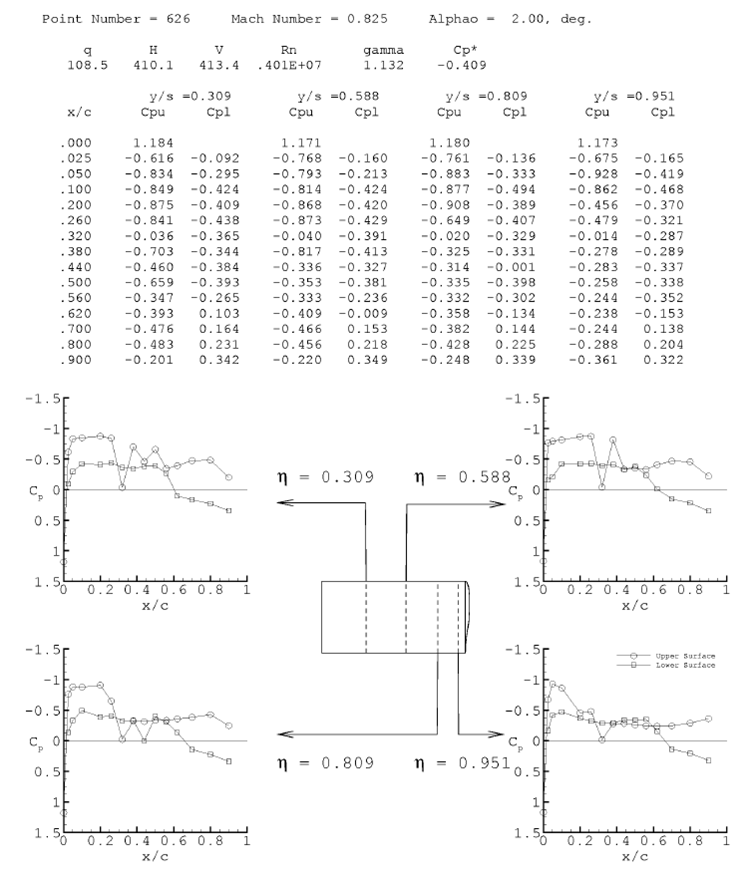
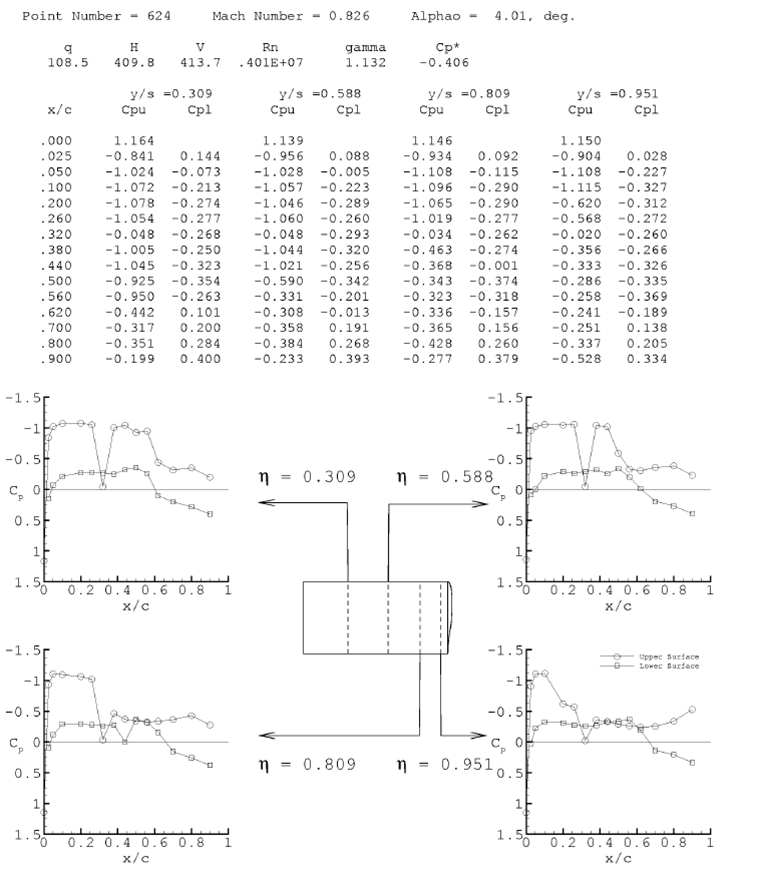
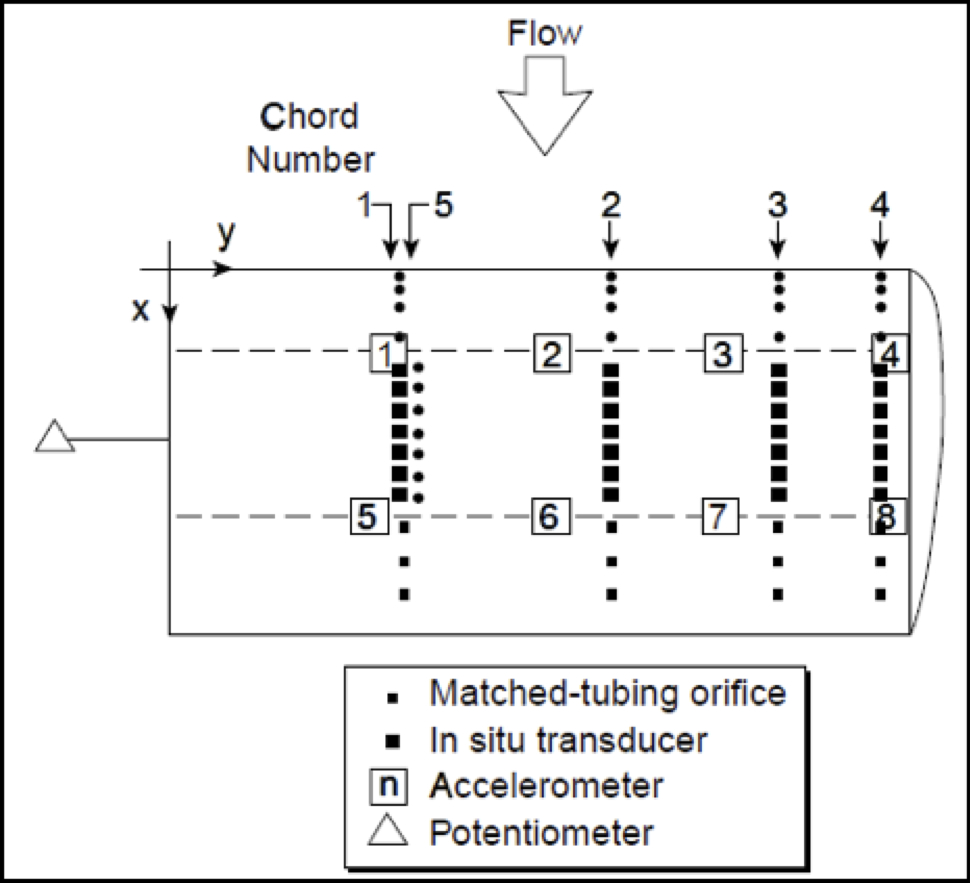
There are 2 types of data available from the RSW test: unforced system("steady") pressure coefficient distributions and magnitude and phase of frequency response functions (FRFs). The statistics- mean values and standard deviation values- of the data sets are available for the unforced system data. For the AePW, data sets with angles of attack of 2° and 4° were chosen. Tables and plots of the original data are shown at the left. The 2° case was chosen to match the mean angle of attack where oscillatory data was available. The 4° angle of attack case was the highest angle of attack case available, intended to stress the capabilities of the steady analysis methods. In the data plots, you might notice several sensors that seem defective. At each span station, the 7th sensor on the upper surface at 32% chord (x/c = 0.32) is thought to be defective for all data points after the transition strip was applied. (i.e. for all AePW data sets) Additionally, during testing the test crew identified that the 8th sensor on the lower surface, at the 3rd span station (η=0.8, 80% span) t x/c = 0.44 to be defective throughout the test. (To read more about this, please download the Analysts Information Package and the BadDataAssessment file.
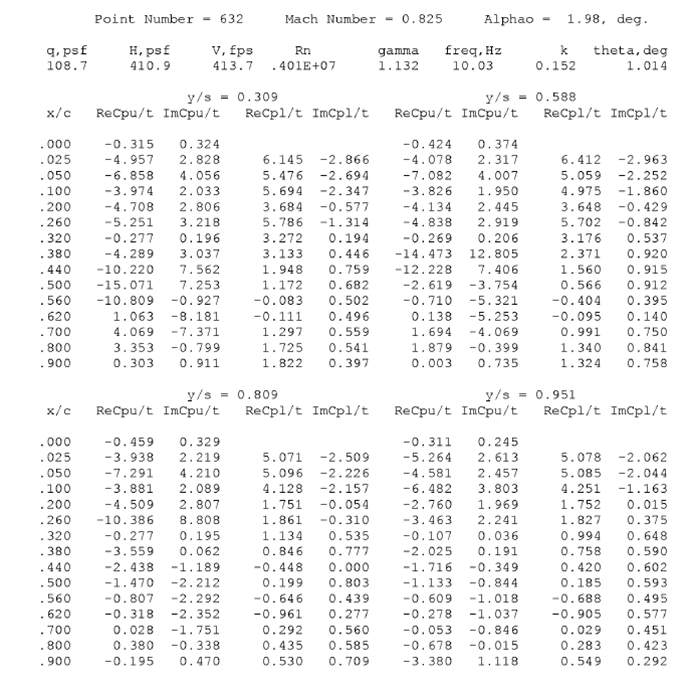
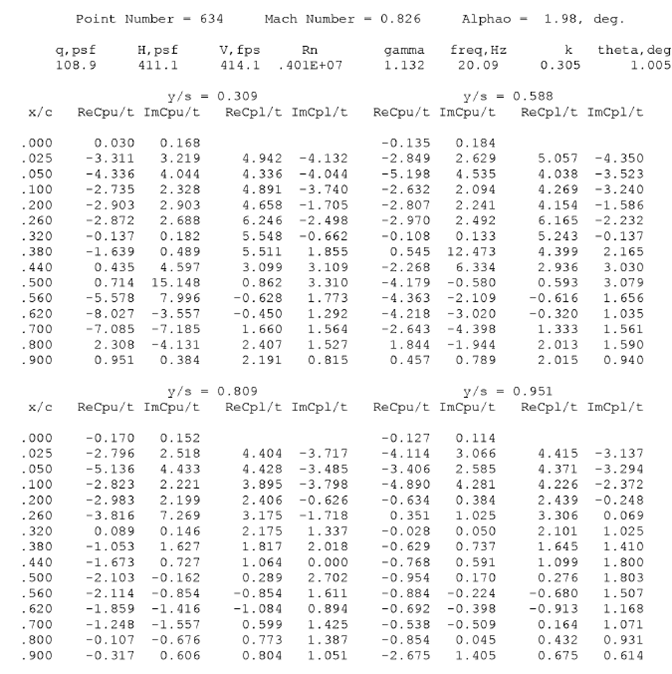
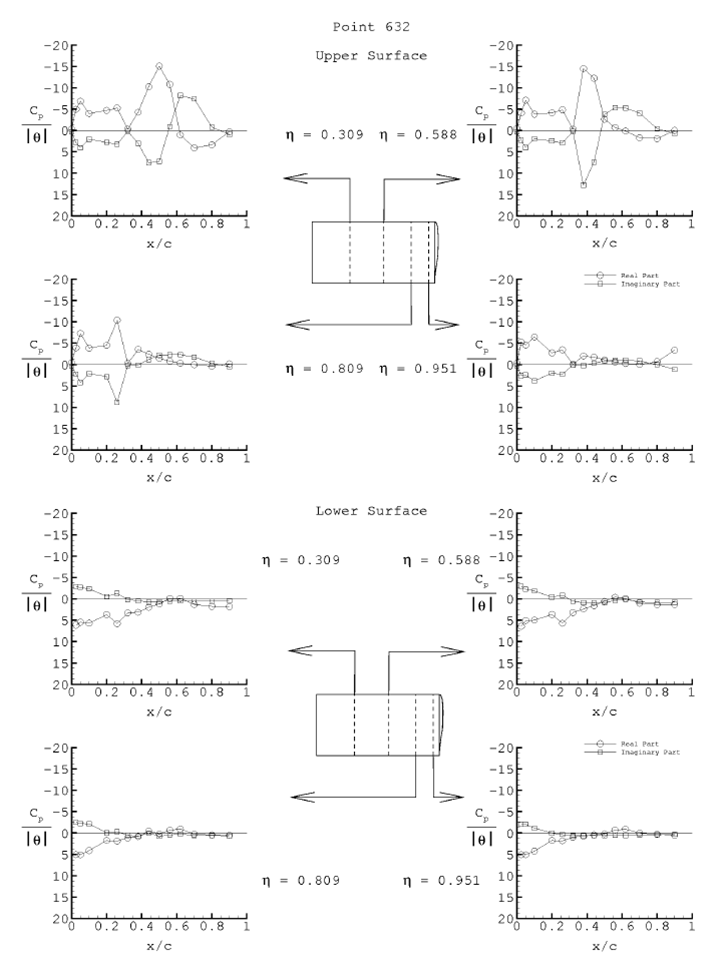
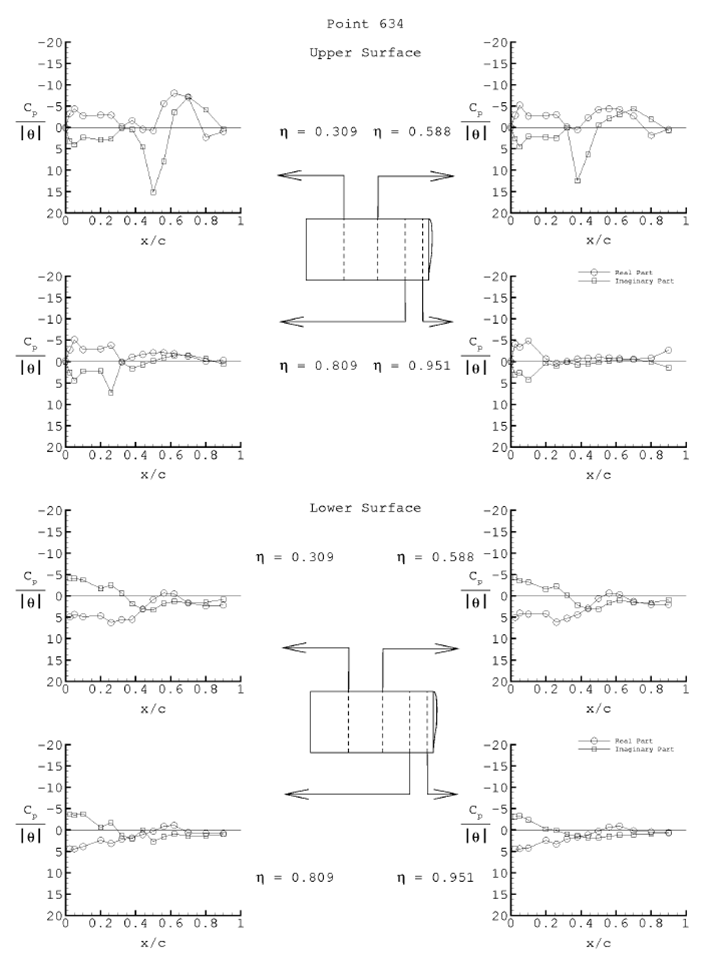
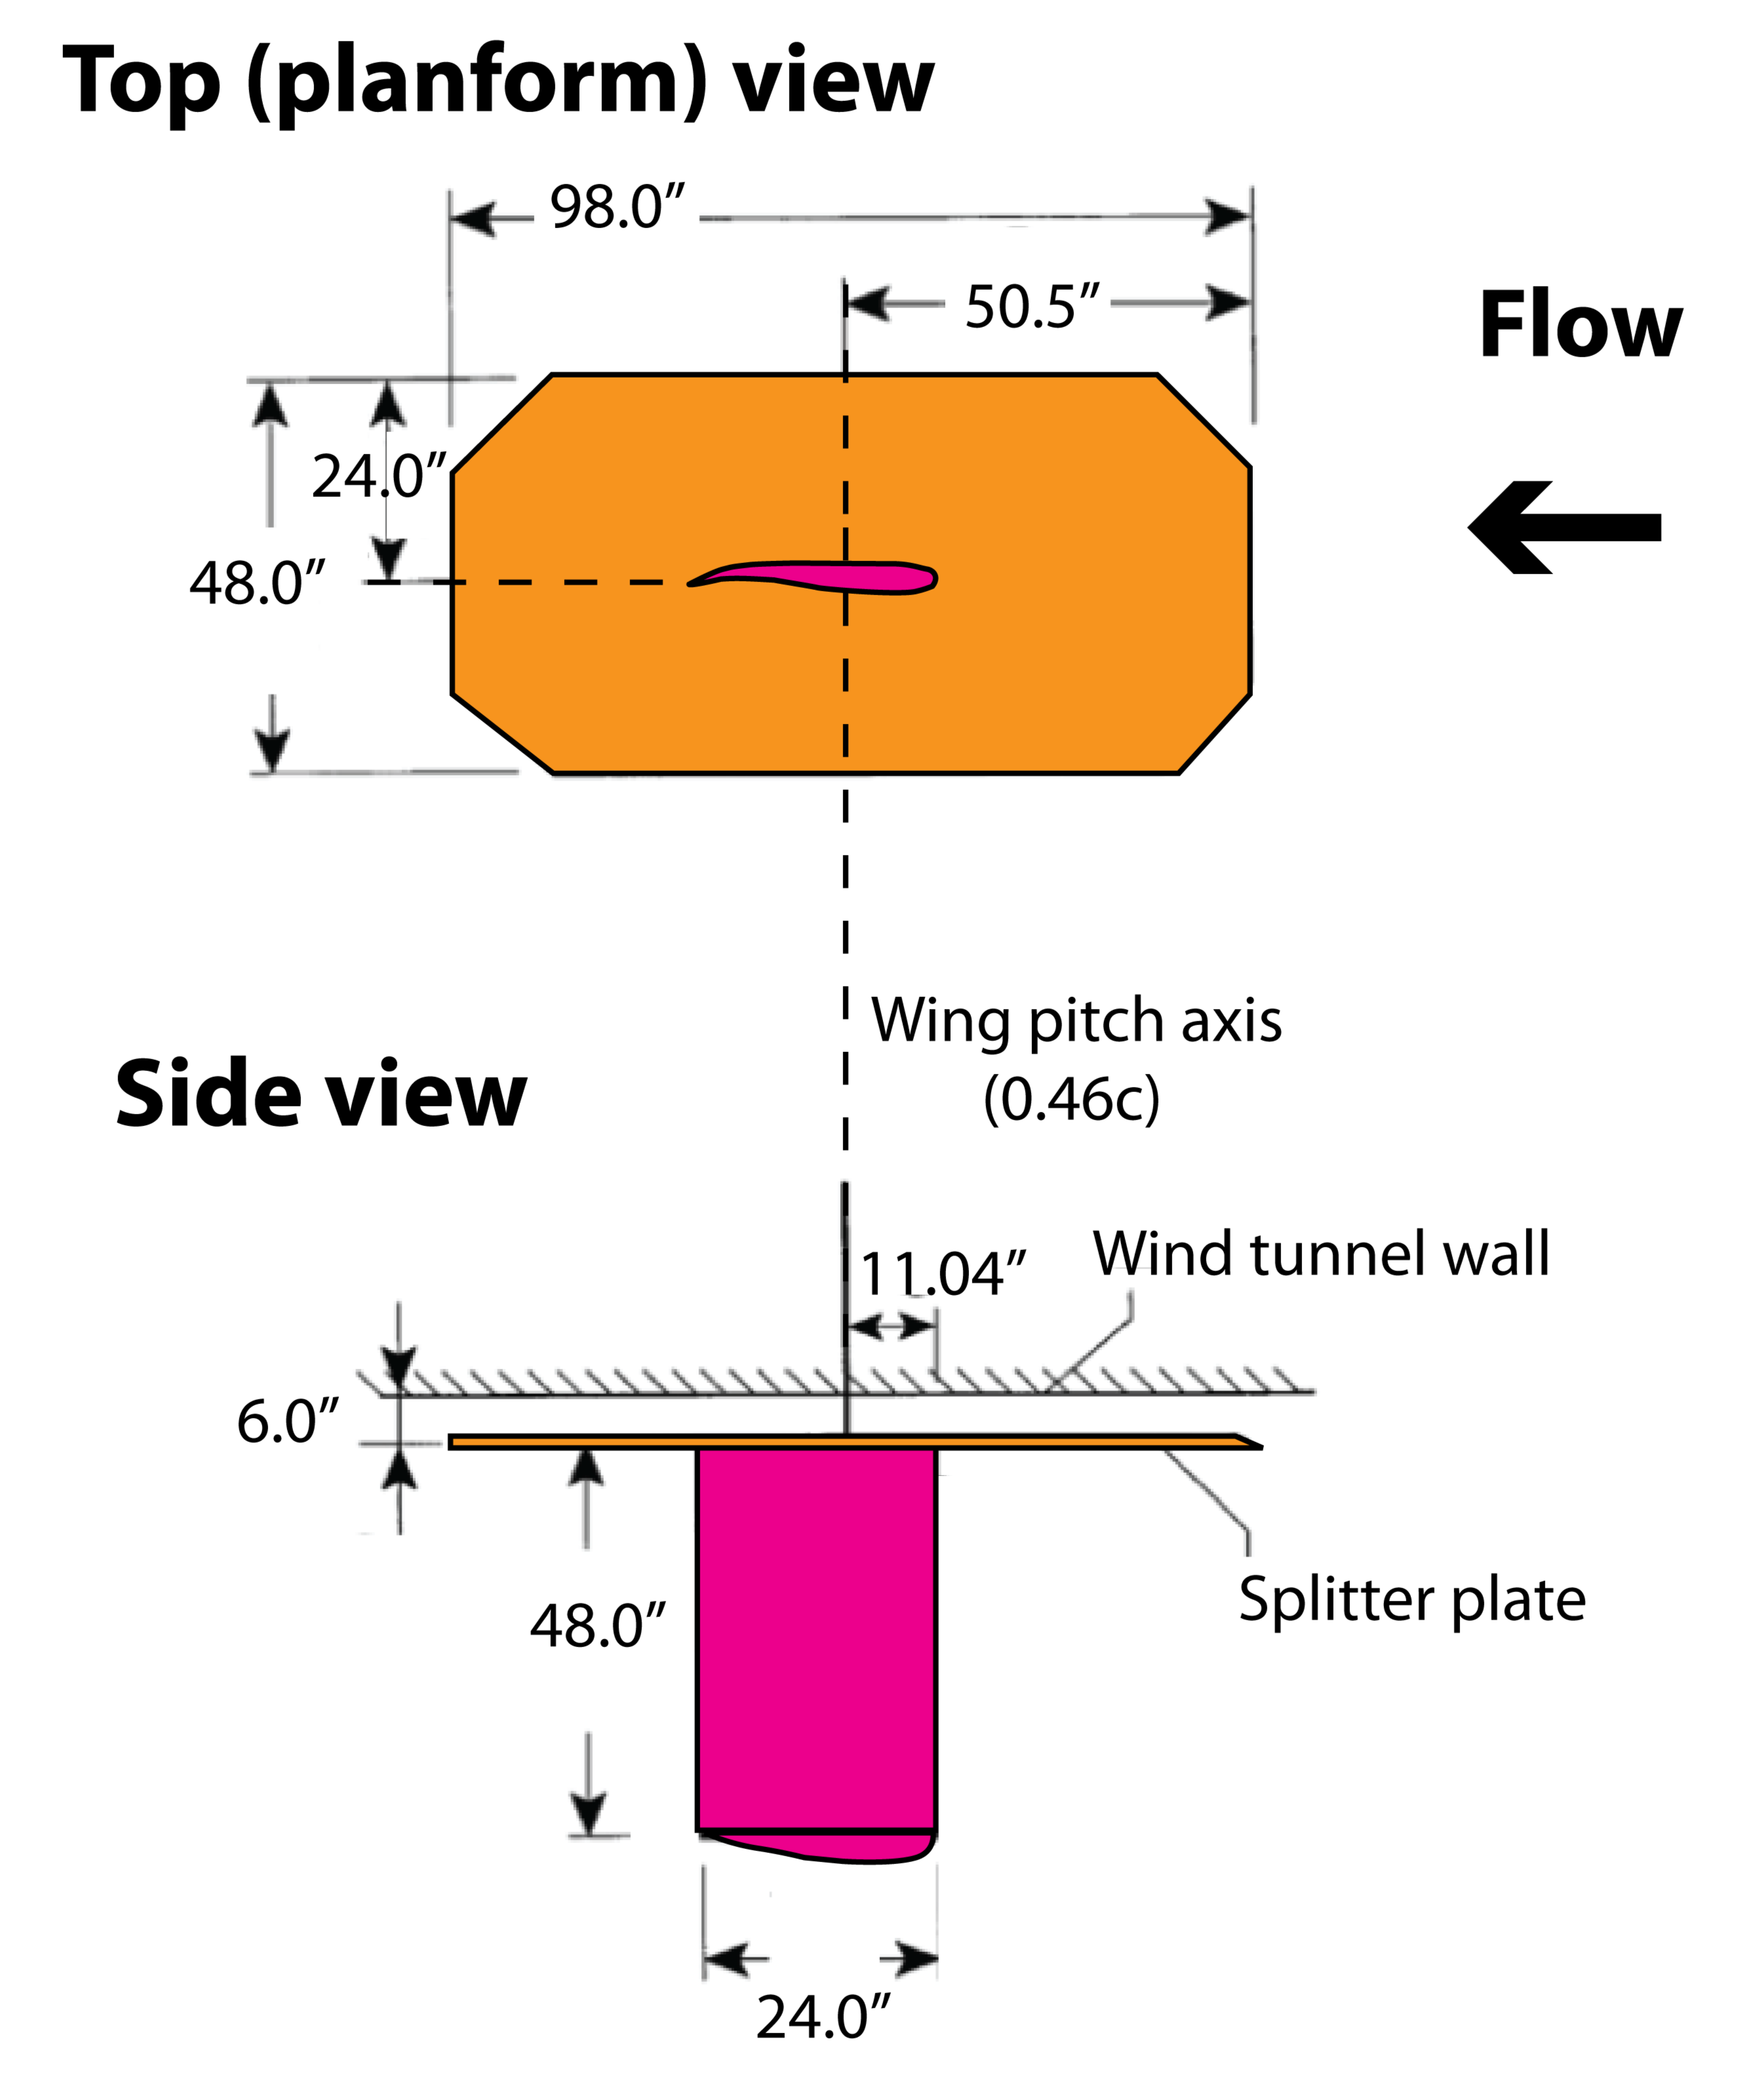
The FRFs are the frequency-domain analysis of data acquired while the model was forced in a pitching motion at a fixed frequency. The model was pitched about the 46% chord, using a wing-root oscillation system. The FRFs are only valid at the frequency of the forcing oscillation. The experimental data is only available at those frequencies. For the AePW, data was utilized for 10 Hz and 20 Hz oscillation frequency.
Note that although the units of θ are given in the image's table header as degrees, the units of
Cp/θ are 1/rad(and thus, units of Re( Cp/θ ) , Im ( Cp/θ ) and Magnitude of Cp/θ are 1/rad)
General notation on the images:
- FRF: frequency response function
- Alpha0: steady or mean angle of attack
- e: real part of the FRF
- Im: imaginary part of the FRF
- Cpu: pressure coefficient on upper surface
- Cpl: pressure coefficient on the lower surface
- t: oscillatory angle, sometimes denoted θ
Example translation: ReCpu/t: Real part of the FRF of pressure coefficient of the upper surface transducers due to angular displacement
10 Hz |
20 Hz |
|
|
|
|
The AePW organizing committee decided to focus on cases with forced transition. While RSW testing was conducted primarily without forced transition from laminar to turbulent flow, there was a subset of the data that was acquired with transition strips, which were located across the entire wing span at 6% chord on both the upper and lower wing surfaces. Because most of the analyses that were performed assumed fully turbulent flow, using data with forced transition at least fixed the transition point, rather than allowing it to be a free variable in the experimental data. The presence of the trip strips was examined in the experimental data for possible influences on the data set. That work is summarized in the ASM paper on RSW lessons learned.
UNITS: There are a number of small errors and omissions that have crept into the RSW information over the decades. There is a special section of the ASM paper that clarifies the units of the FRFs in particular. The original data reported in NASA TM-85765: The values given in Table V (real, imag, magnitude) were NOT normalized by the amplitude of the excitation. i.e. they are not Cp/Q, but rather just Cp. The RTO report (TR-026 and electronic data used for AePW) states that the FRF values are in 1/degree. We have found this statement to be in error. The units for the comparison data for AePW are 1/rad. Evidence: We modified the TM-85765 data by dividing by T, in radians. The values were then equal to those published in TR-026. This was done for several sensor locations for data points 262, 513 and 632.
There are 4 chords of unsteady pressure measurements on the wind tunnel model. Those locations are given on the Configuration and Background webpage .
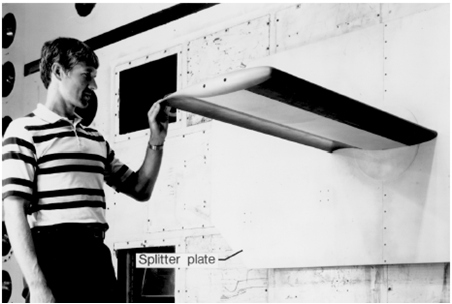
The wind tunnel wall and mounting of the RSW played a large role in complicating analysis of this configuration. The known deficiencies of this configuration include:
- Undersized splitter plate
- Splitter plate located such that it, and the inboard 1/3 of the wing are buried in the wing tunnel wall boundary layer
- The wind tunnel wall slots were open. This has been demonstrated to have a significant effect on the steady lift coefficient. Recent work also reveals that there is likely local dynamic flow effects introduced by the proximity to the open slot.
Download data files
The experimental data was assembled into databases with structures matching the formats of the computational data. Those database files are located in the database repository.
The files found below are the ascii files in tecplot format that were supplied to the analysis teams prior to the workshop.
|
RSW_AePW_expdata_Feb10_2012.ZIP Experimental Results, in tecplot format, with bad data points removed (both steady and unsteady results are contained in this zip file) Unsteady results are Frequency Response Functions of pressure coeffients due to oscillatory angle of attack, where angle of attack is in radians. Unsteady results are presented in both rectangular form (Real and Imaginary components) and polar form (Magnitude and Phase). |
|
Tecplot files comparing the with and without transition strip information. These data sets were used to determine that all 4 sensors on the upper surface at x/c = .32 were malfunctioning during the runs pertinent to AePW (transition strip on). The file also shows the lower surface sensor at span station 3, x/c = 0.44, which was declared non-functional by the RSW test crew. |
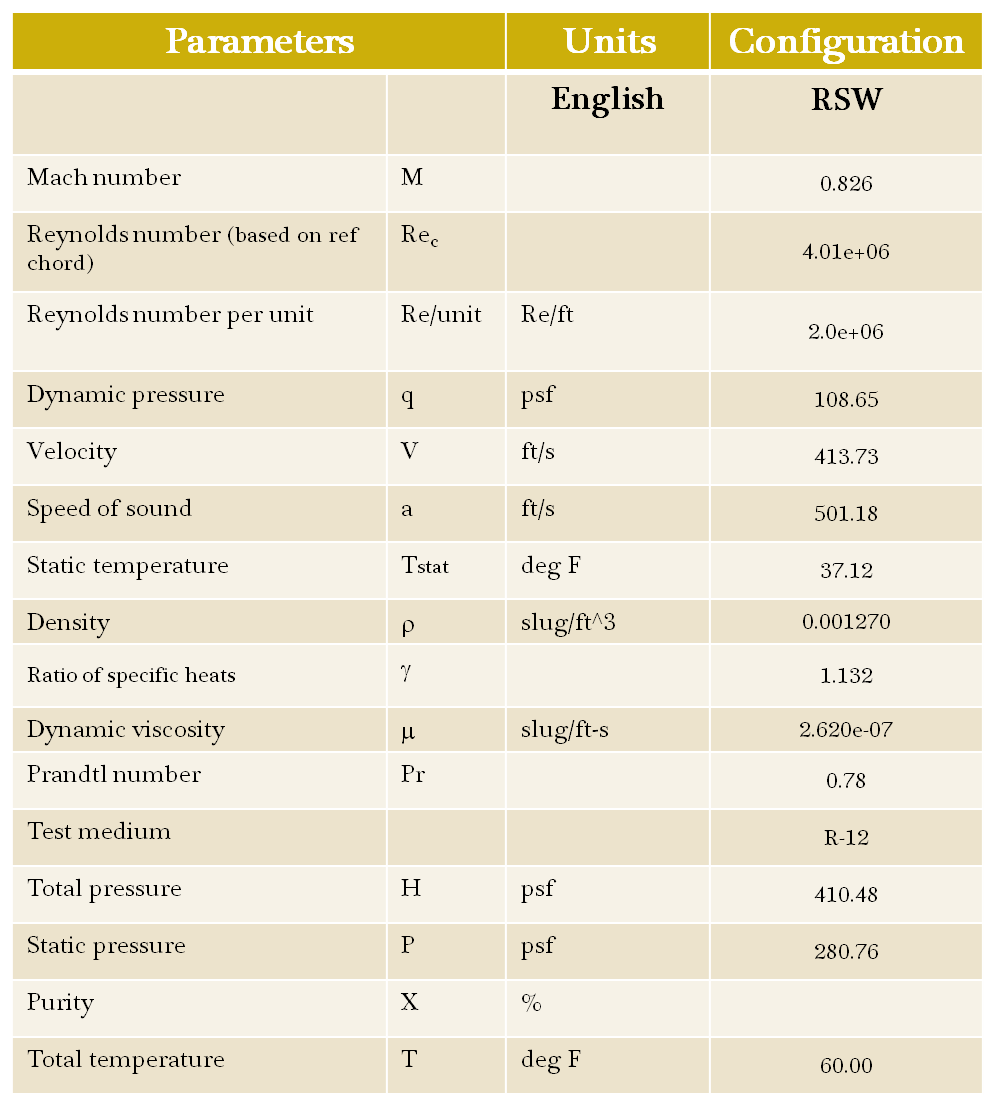
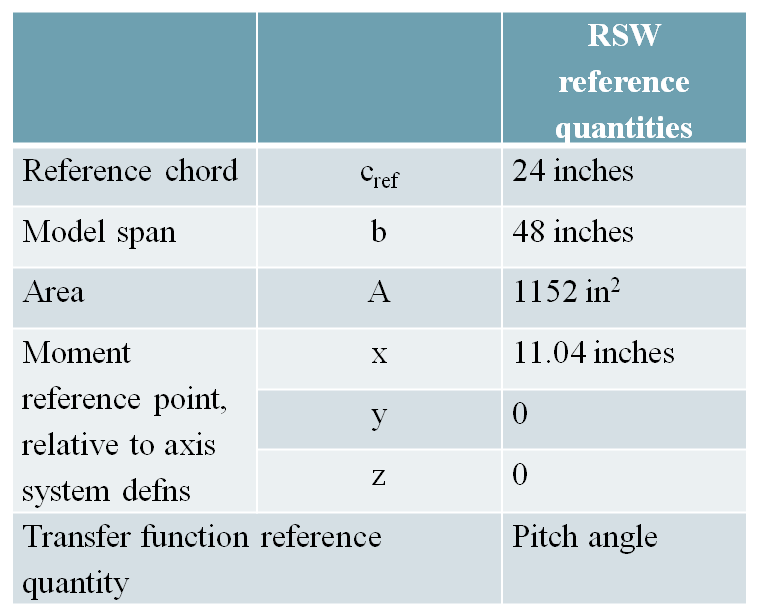
Reference Quantities
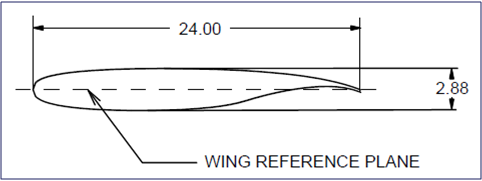
Model Geometry
Publications and Presentations
Lessons learned in the selection and development of test cases for the Aeroelastic Prediction Workshop: Rectangular Supercritical Wing A summary paper including analysis of the experimental data and comparison with the computational results was presented at the 2013 AIAA Aerospace Sciences Meeting in Grapevine Texas. and the accompanying Presentation slides.
Geometrical and Properties of a Rectangular Supercritical Wing Oscillated in Pitch for Measurement of Unsteady Transonic Pressure Distributions; Ricketts, Watson, Sandford and Seidel - Nov 1983 (Ricketts)
AIAA-JA_vol21_no8.pdfTransonic Pressure Distributions on a Rectangular Supercritical Wing Oscillating in Pitch; Ricketts, Sandford, Seidel, Watson, Journal of Aircraft, Vol 21 No 8, 1983
1999046117.pdfComputational Test Cases - early RSW (Ricketts - in RTO publicaton) - Complete results are in NASA TM 85765 - Subsonic and Transonic Unsteady- and Steady-Pressure Measurements on a Rectangular Supercritical Wing Oscillated in Pitch by Ricketts, Sandford, Watson